COOs in the oil and gas industry often have a background in engineering, geology, or business, and may have previous experience in a leadership role within the industry. They have a strong understanding of the technical and financial aspects of the industry.
For a Chief Operating Officer (COO), it's crucial to have a clear understanding of key performance indicators (KPIs) that drive the success of the organization. These KPIs can include operating costs per barrel of oil, free cash flow, commodity prices, and operating income.
Unlike generic financial metrics, Operating cashflow is generated everyday and its built on deep technical expertise. Its influenced by a range of factors, including market conditions, regulatory environments, and global economic trends.
As we had mentioned last article, commodity prices, Production and Costs are a big components of Operations cashflow. There are a few strategies that COOs have to bring some stability to changing commodity prices and what they can get paid at the Well head. Reviewing investor presentations of Exxon, Shell, EOG, Diamond Back, Pioneer, Oxy here are few interesting data points on costs and oil prices
Commodity prices: (In 2021) Diamond back, sold Oil for the highest price $54.50/barrel, Pioneer and EOG sold their Gas for the highest price Gas $3.40 per thousand cubic feet of natural gas
Exxon Mobil reported an average price of $52.50 per barrel of oil and $3.25 per thousand cubic feet of natural gas.
Chevron reported an average price of $53.50 per barrel of oil and $3.15 per thousand cubic feet of natural gas.
Shell reported an average price of $54.00 per barrel of oil and $3.20 per thousand cubic feet of natural gas.
Pioneer reported an average price of $53.75 per barrel of oil and $3.40 per thousand cubic feet of natural gas.
Oxy reported an average price of $52.00 per barrel of oil and $3.30 per thousand cubic feet of natural gas.
EOG reported an average price of $53.75 per barrel of oil and $3.40 per thousand cubic feet of natural gas.
Diamondback reported an average price of $54.50 per barrel of oil and $3.25 per thousand cubic feet of natural gas.
Operating costs per barrel of oil (in 2021): Reducing operating costs is a key goal for many oil and gas companies. Pioneer and EOG have the lowest boe at $13.62 (something to be aware of we're missing the debt that new wells have to pay off, example its about $7-$10M to drill and frac a well before it starts to producing oil. This $7M is in addition to the $13.62/boe)
Exxon Mobil reported an operating cost of $16.50 per barrel of oil equivalent (boe)
Chevron reported an operating cost of $17.35 per boe
Shell reported $18.24 per boe
Pioneer reported an operating cost of $13.62 per boe
Oxy reported $14.50 per boe
EOG reported $13.62 per boe
Diamondback reported an operating cost of $16.25 per boe.
Lets look basic core strategies of Oil and Gas, key components of the business. Smaller E&Ps skip 4 and 5. Production and Efficiency are terms widely used. Its very complex and the KPIs are distributed between several technical groups that needs to be analyzed simultaneously to exceed targets
- Exploration and development: All of these companies engage in exploration activities to identify and evaluate new oil and gas reserves, and they may also invest in the development of these reserves to bring them into production.
- Production: Once oil and gas reserves have been discovered and developed, these companies will typically produce and sell oil and gas products to customers around the world.
- Efficiency: To optimize their operations, these companies may focus on reducing costs, improving productivity, and maximizing the value of their assets.
- Sustainability: Many of these companies are also focused on sustainability and may implement strategies to reduce their environmental impact and meet the growing demand for cleaner energy sources.
- Diversification: Some of these companies may also diversify their operations by investing in other energy sources, such as renewable energy, or by expanding into other sectors, such as chemical manufacturing or retail.
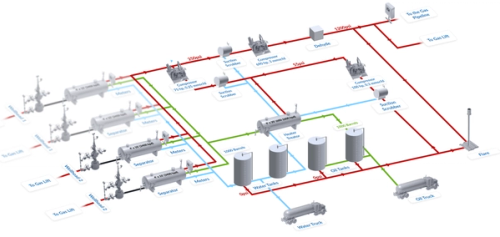
Given below is a sample overview of Oil and Gas operations. We'll dive into the component details at a later time. Essentially the Wells produce Oil, Water and Gas. They are then separated - Oil, Water and Gas. Oil and Gas are sold, Water is disposed.
Oil and Gas = Revenue, Water = Cost
The overarching strategy is to analyze 3 areas (with KPIs) meticulously
- Optimize through technical analysis each component in Operations - example Wells, Separator, Heater Treator, Compressor, Pumps, Pipelines etc. This is where the complexity lies, as one needs to look at the static data of each piece and then in relation to the next piece in Operations. Finally optimize the entire sequence of Oil Production to Oil Sales
- Estimate Revenue autonomously - Example Production increase, analyze and predict using data from gas, oil, meters, tank levels, etc
- Estimate Costs autonomously - Example - Electric power consumption (Example ESP, Surface Pumps), workover, leasing cost of compressor, chemicals, materials, supplies, etc
Oil and Gas Upstream Facilities
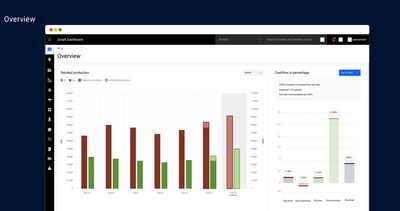
Production volume: This KPI measures the total amount of oil and gas produced by a company's wells and facilities. By optimizing, predicting production and increasing volume, a COO can generate more revenue and improve cashflow

Oil and Gas Production - Estimating and Predicting revenue everyday
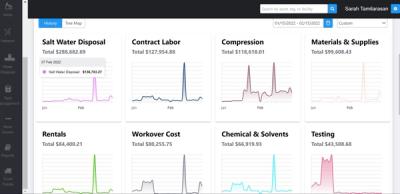
Operating costs: This KPI measures the costs associated with running a company's operations, including labor, materials, and overhead expenses. By reducing operating costs, a COO can improve profitability and cashflow

Sample Oil and Gas Operating Costs
In addition to the above there are several additional details that COOs track such as Markets, Return on capital employed (ROCE), Net debt to EBITDA, etc
Overall, the specific strategy that a COO in the oil and gas industry is crafted based on the needs and goals of the organization. By tracking relevant data and metrics, a COO can make informed decisions to drive the success of the business and boost cash flow
At SOTAOG our innovative AI and deep engineering technology allows us to analyze and predict cash flow with unparalleled accuracy, enabling COOs in Oil and Gas across the globe to make informed decisions that drive success.
We offer a $0 pilot program to allow you to see firsthand the benefits of our AI and deep engineering technology, just like we have for our current clients. We are confident that our solutions can help your company reach new heights of success.
Sign up for our $0 pilot program today and see the results
SOTAOG does all the heavy lifting for integration. The setup is simple - encompasses 2 meetings with the operations team, we take siloed groups of data start integration, within 1-2 weeks we show recommendations to drive additional cashflow.
